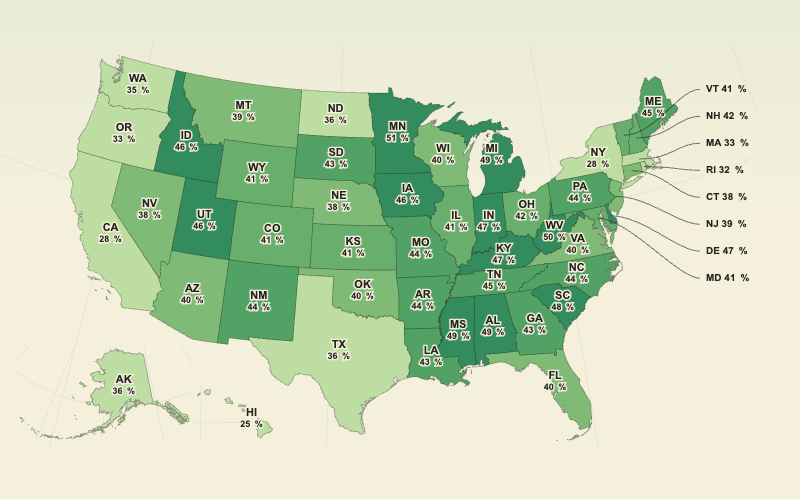
Choropleth map
Color areas by a rate, percentage, change, or category. Use smooth color or class breaks.
Make interactive maps for reports, presentations, and data stories. Enter values or upload a CSV, then export an image or publish a shareable link through your ArcGIS account.
No account needed to create or export. Works in your browser.
Explore real datasets, see how each map works, and customize an example with your own values.
Map real data with a familiar workflow, or build an original world from a grid.
Choose the map you want, then add compatible data.
Choose the result first → 02Start with a geographyOpen a ready-made table or download a CSV template with stable place IDs.
Enter or download → 03Bring your own dataUpload or paste a CSV. Review suggested location and value fields before mapping.
Import and check data → 04Create a worldPaint a square or hex grid, add places and facts, then let people explore your fictional map.
Open the world builder →Use color for patterns, size for magnitude, and points for exact locations.
Color areas by a rate, percentage, change, or category. Use smooth color or class breaks.
Compare U.S. states and D.C., European countries and territories, or subdivisions of India and Australia with equal-size hex tiles.
Scale circles or squares by magnitude. Available for selected area geographies with numeric values.
Plot locations with fixed or value-scaled symbols, category colors, popups, and automatic clustering.
Compare coordinate-based values by height on a dotted globe, with a switchable 2D view.
We provide the boundaries; you supply the values. Choose an administrative level or bring latitude and longitude, then match names or stable identifiers. Examples include their own sourced data.
Map boroughs, districts, wards, and neighbourhoods across 18 cities—from London, New York, and Los Angeles to Tokyo, Hong Kong, Delhi, São Paulo, and Cape Town. Each city loads its own optimized boundaries. View city examples → Check divisions and coverage →
Use all states and D.C., the contiguous 48, a practical seven-region map, official Census regions and divisions, or states plus five populated territories shown as labeled insets. HHS regions, counties, and 2020 Census ZCTAs are also available.
All 13 provinces and territories, matched by names, postal abbreviations, or PRUIDs.
Country maps plus France’s 18 regions or 101 departments, Germany’s 16 states, Italy’s 20 regions, the Netherlands’ 12 provinces, Spain’s 19 communities and cities, and the UK’s four constituent countries. A focused UK, Ireland, and Crown Dependencies view includes the Isle of Man, Jersey, and Guernsey.
Ready-made country groups for all eight SAARC members and 11 Southeast Asian countries, plus Mainland and Maritime Southeast Asia. Every SAARC member also has subdivision boundaries.
Use focused continental views to compare individual countries across Africa or South America. Sourced examples cover health, population, urbanization, forests, and development.
Compare six continents using one combined shape and value per continent; Antarctica is excluded.
States, provinces, regions, counties, districts, planning areas, and equivalent subdivisions in 31 countries, now including the Netherlands and Thailand. Load one country at a time; match names or ISO 3166-2 codes where available.
Map coordinates directly, geocode places when signed in, or connect a public ArcGIS point Feature Layer. Live points stay at their source and refresh when the map opens.
Latest additions: Chicago, Paris, Toronto, Berlin, Sydney, and Melbourne join London, NYC, and Los Angeles, each with an editable city example; UK constituent-country and UK–Ireland regional examples, sourced Africa and South America examples, live public ArcGIS layers, French regions alongside departments, comparable-series color scales, Netherlands provinces, Thailand provinces, Census regions and divisions, and 22 UN M49 subregions. Check supported sources, identifiers, and limits →
Choose ColorBrewer or Mapfetti palettes, class breaks, change maps, bivariate color matrices, and area patterns. Try ocean, paper, plain, or decorative topographic backgrounds where the map format supports them.
Add a map/table toggle or a collapsible table beside the map. Enable data search and let viewers explore related measures with the series selector.
Download PNG, JPEG, or SVG in four aspect ratios and three sizes. Save an editable map file, or publish a public viewer through ArcGIS.
Mapfetti is free to create, edit, and export with no account required. CSV processing, map styling, and image exports run in your browser. Save an editable map file to continue later.
Live ArcGIS maps request public features directly from their source and save only the layer URL, filter, and map settings. Address geocoding sends locations to ArcGIS. Publishing stores settings in a public ArcGIS item. Sign-in is required only for geocoding and publishing.
No account is needed to create or export. Optional geocoding and publishing use your ArcGIS account and its terms.
Export it as CSV or paste a table with column headers. Check matched locations, choose numeric values or categories, and exclude rows before mapping. Coordinate columns work directly; address geocoding uses ArcGIS.
Your latest draft is saved in this browser. Use Map file → Download editable map to keep a portable copy, then Open saved map to continue editing.
Examples and published maps adapt to phones. The editor needs a window wider than 680 pixels for data tables and the preview. Explore examples on any screen.

No code. No account to get started.